
Online training - Call us on 1300 009 924
Online training - access your course anytime, anywhere! Call us on 1300 009 924
Technology

AI-Powered Data Analyst Course

SL-DA
12 Months
Virtual classes + self-paced
8 Modules + 2 Electives
Start Immediately
Pay upfront & save
Internship Opportunities Available
In partnership with
Upskilled Simplilearn Logo

Course Overview

Data analysts don't spend their days typing formulas any more. AI now handles a lot of the repetitive work. Employers want someone who asks good questions, knows the tools, and can tell when an answer sounds convincing but is wrong. This course was put together with that in mind.

The AI-Powered Data Analyst Course is an online program delivered by Simplilearn in collaboration with Microsoft. First up is statistics and how data moves through a business. After that, it's hands-on work in Excel, SQL, Python and Tableau. Microsoft Copilot and other generative AI tools come in throughout, helping you clean data, write queries and draft insights. You'll also automate everyday reporting with no-code tools like Zapier, Make and n8n.

Classes run live online with expert instructors, with self-paced lessons and recordings in between, so you can fit study around work. You'll have 12 months of access to finish everything. By the end you'll have a portfolio of real projects and a capstone to show employers. And you don't need any coding experience to start. 

What you will learn

  • Use descriptive statistics and hypothesis tests (Z-test, T-test and ANOVA) to answer real business questions.
  • Map how data flows from source systems to a warehouse and a dashboard, and know when to use ETL or ELT.
  • Clean and analyse data in Excel with XLOOKUP, PivotTables, Power Query and DAX, then use Copilot to speed up the work.
  • Write SQL in MySQL, from simple joins to window functions and CTEs, and use AI to draft and debug your queries.
  • Analyse data in Python with pandas and NumPy, chart it with Matplotlib and Seaborn, and run regression and A/B tests.
  • Build interactive Tableau dashboards and data stories, including AI-driven predictions.
  • Automate reports, alerts and data checks with Zapier, Make, n8n and Power Automate.
  • Check AI-generated output before you rely on it, and know when your own judgement should win.
  • Prepare for the Microsoft PL-300 Power BI Data Analyst exam through an optional elective.
  • Take a business problem from raw data to an AI-assisted recommendation in your capstone project.

Tools covered

What you'll use it forTools
Spreadsheets and AI assistantsMicrosoft Excel, Microsoft Copilot, ChatGPT
DatabasesMySQL
ProgrammingPython, Jupyter Notebook, Visual Studio Code (VS Code), GitHub, GitHub Copilot
Python data librariespandas, NumPy, Matplotlib, Seaborn
Dashboards and visualisationTableau, Power BI
Automation and alertsZapier, Make, n8n, Power Automate, Slack


You won't need to buy paid software or subscriptions to finish the course.

Interpersonal skills you will learn along the way:

  • Analytical thinking
  • Asking the right business questions
  • Communication and data storytelling
  • Critical thinking, including checking AI output
  • Data-driven decision-making

Career support that goes the distance

Finishing the course is just the start. Our internship program helps you turn what you've learned into real work experience and industry contacts.

Upskilled Internships

Get real Australian work experience on your CV. Complete 80% of your course and you can apply for a 12-week internship with a top host company, delivered with Career Success Australia. Past placements include NAB, BHP, PwC, Telstra and IBM.

Get in touch to know more.*

*Terms and conditions apply.
Course Modules

The course is made up of seven core modules and a capstone project, plus two optional electives. Each module builds on the last, taking you from the basics of statistics and data through analysis, visualisation, and automation.

Most of the core learning happens in live online classes. In between, you'll work through self-paced lessons, guided practice and hands-on projects. Here's what each module covers.

This self-paced module covers the statistics analysts reach for most, from averages and spread to correlation. You'll practise turning a business question into a hypothesis, choosing a test and explaining what the result does and doesn't prove. The rest of the course leans on this, so it's worth getting right.

Topics covered

  • Central tendency and dispersion
  • Skewness and correlation
  • Hypothesis testing
  • Z-test, T-test and ANOVA
  • Reading p-values
  • Making evidence-based decisions

It helps to know where data comes from before you start analysing it. You'll follow data from source systems into warehouses, lakes and lakehouses, then out to a dashboard. Next you'll compare ETL with ELT and run basic quality checks on rows, nulls and ranges. A guided exercise then has you sketch your own end-to-end pipeline.

Topics covered

  • The analytics lifecycle
  • Data warehouses, lakes and lakehouses
  • ETL and ELT
  • Pipeline design and data transformation
  • Data quality checks and governance

Excel is still where a lot of analysis happens. You'll clean and standardise raw data, build PivotTables and Power Pivot models, write DAX measures and design an interactive KPI dashboard. Copilot comes in after that to suggest insights and draft commentary. You'll also learn to check its work instead of taking it at face value.

Topics covered

  • Data cleaning, XLOOKUP and dynamic arrays
  • PivotTables, Power Pivot and DAX
  • Interactive dashboards with slicers and timelines
  • Forecasting and what-if analysis
  • Power Query
  • Prompting Copilot in Excel

SQL is the language most analysts use every day to pull data out of databases. Working in MySQL, you'll design normalised tables, join them and turn aggregations into KPIs. Later you'll tackle window functions, subqueries and CTEs. Copilot helps you generate and debug queries, while indexes and EXPLAIN plans make them run faster.

Topics covered

  • Relational design and normalisation
  • CRUD operations and joins
  • Window functions, subqueries and CTEs
  • Query optimisation with indexes and EXPLAIN
  • Generating and debugging SQL with Copilot
  • MySQL Workbench

You don't need any programming background for this one. You'll write Python from scratch in Jupyter, then use pandas and NumPy to import, audit and clean real datasets. From there it's exploring patterns with Matplotlib and Seaborn, running hypothesis tests and fitting a regression model. You'll also design an A/B test, the kind businesses run on websites and campaigns.

Topics covered

  • Python fundamentals
  • Data wrangling with pandas and NumPy
  • Handling missing values and outliers
  • Exploratory data analysis and visualisation
  • Regression and A/B testing

It's the longest module in the course. Analysis only helps if people can follow it. You'll build everything from bar charts to Pareto charts and maps, combine datasets, and create dashboards and stories that lead with a clear recommendation. You'll also work with LOD expressions and Tableau's built-in AI predictions.

Topics covered

  • Choosing the right chart
  • Filters and parameters
  • Relationships, joins and blending
  • Calculated fields and LOD expressions
  • Dashboards and data stories
  • Einstein AI predictions in Tableau

A lot of an analyst's week goes on repeat jobs like refreshing reports and chasing data issues. This module hands that work to no-code and low-code tools. You'll build multi-step workflows in Zapier, Make and n8n, add AI steps that classify and summarise data, connect APIs and webhooks, and send alerts to Slack when something looks off.

Topics covered

  • Workflow automation and orchestration
  • Zapier, Make, n8n and Power Automate
  • APIs and webhooks
  • AI steps that classify, enrich and summarise data
  • Automated Power BI refreshes and Slack alerts
  • Error handling, retries and logging

The capstone puts you in the role of lead consultant on a real business problem. You'll build the whole pipeline yourself, from getting the data to adding an AI agent. Then you'll pair Power BI or Tableau visuals with AI-driven recommendations and present what you found to a stakeholder panel. It's a good one to put in front of employers.

Topics covered

  • Framing the business problem
  • Getting and preparing the data
  • Analysis and visuals in Power BI or Tableau
  • Building an AI agent into the workflow
  • Presenting evidence, assumptions and recommendations

Two electives are included with your enrolment. You don't have to complete them to finish the course, but they're worth doing if you want to go further with Power BI or see how analytics works in a particular industry. Both use official Microsoft content, and you'll receive a Microsoft course completion certificate on Microsoft Learn for the Microsoft courses you complete.

  • Elective 1 - AI-Powered Dashboards with Power BI and PL-300 Certification Training
    You'll prepare and model data in Power BI, write DAX measures and design reports, then publish dashboards through the Power BI service. The content also prepares you for the Microsoft PL-300 Power BI Data Analyst exam. The exam itself isn't included, so you'd book and pay for it with Microsoft if you decide to sit it.
  • Elective 2 - Industry-Aligned Analytics: Manufacturing, Marketing and Finance
    This elective looks at how analysts in different industries actually use AI. Using Microsoft 365 Copilot agents such as Researcher, Analyst and Prompt Coach, you'll research market trends and build reusable campaign prompts. On the finance side, you'll explain budget variances and turn results into summaries and visuals senior leaders can act on.

Payment Options

Pay Upfront and Save
You pay $850
RRP $2500

Upskilled Payment Plans

For Upskilled courses delivered by Simplilearn - we can arrange for you an interest-free, flexible and easy to manage monthly payment plan.

Course projects

You'll work on more than 10 industry projects built on publicly available datasets, plus your capstone. Here's a look at the projects you'll complete:

Retail Sales Performance Analysis
Use Excel formulas, PivotTables, charts and Copilot to dig into a retailer's sales and profit.

E-commerce Sales Dashboard in Excel
Build an interactive dashboard that tracks sales trends, top products and revenue growth by category.

Retail Point of Sale Analysis
Query transaction data in SQL to understand customer segments, product categories and returns.

Air Cargo Analysis
Use SQL on historical airline data to find trends and suggest ways to improve service.

Employee Performance Mapping
Design an SQL database that maps employee performance and produces reports for appraisals and promotions.

Marketing Campaign Impact Analysis
Clean campaign data in Python, test what's driving results and recommend where to focus acquisition spend.

Customer Order Analysis with Python
Group products and spot buying patterns in customer order data using Python data structures.

Python Adventure Game with GitHub Copilot
Code a simple text-based game with GitHub Copilot to practise loops, lists and functions.

Customer Conversion and Sales Intelligence Dashboard
Combine Tableau and Einstein AI to show where customers drop out of the sales funnel.

Crime Analytics Dashboard with Tableau
Build a dashboard and visual story that keeps police and city authorities across crime hotspots.

Regional Sales Performance in Tableau
Compare sales between two regions and explain what's driving growth in each.

Zomato Data Reporting with Power BI
Report on global restaurant data by location, cost, rating and cuisine.

Insurance Metrics Dashboard in Power BI
Track and compare performance across ten regional insurance companies.

Airline Operations and Delay Analysis
Visualise flight punctuality and the causes of delays across airlines and airports.

AI-Powered Lead Management Automation
Use Zapier to capture, sort and route sales leads, alert the sales team and send a regular report.

Show off your achievements

Earn your AI-Powered Data Analyst certificate

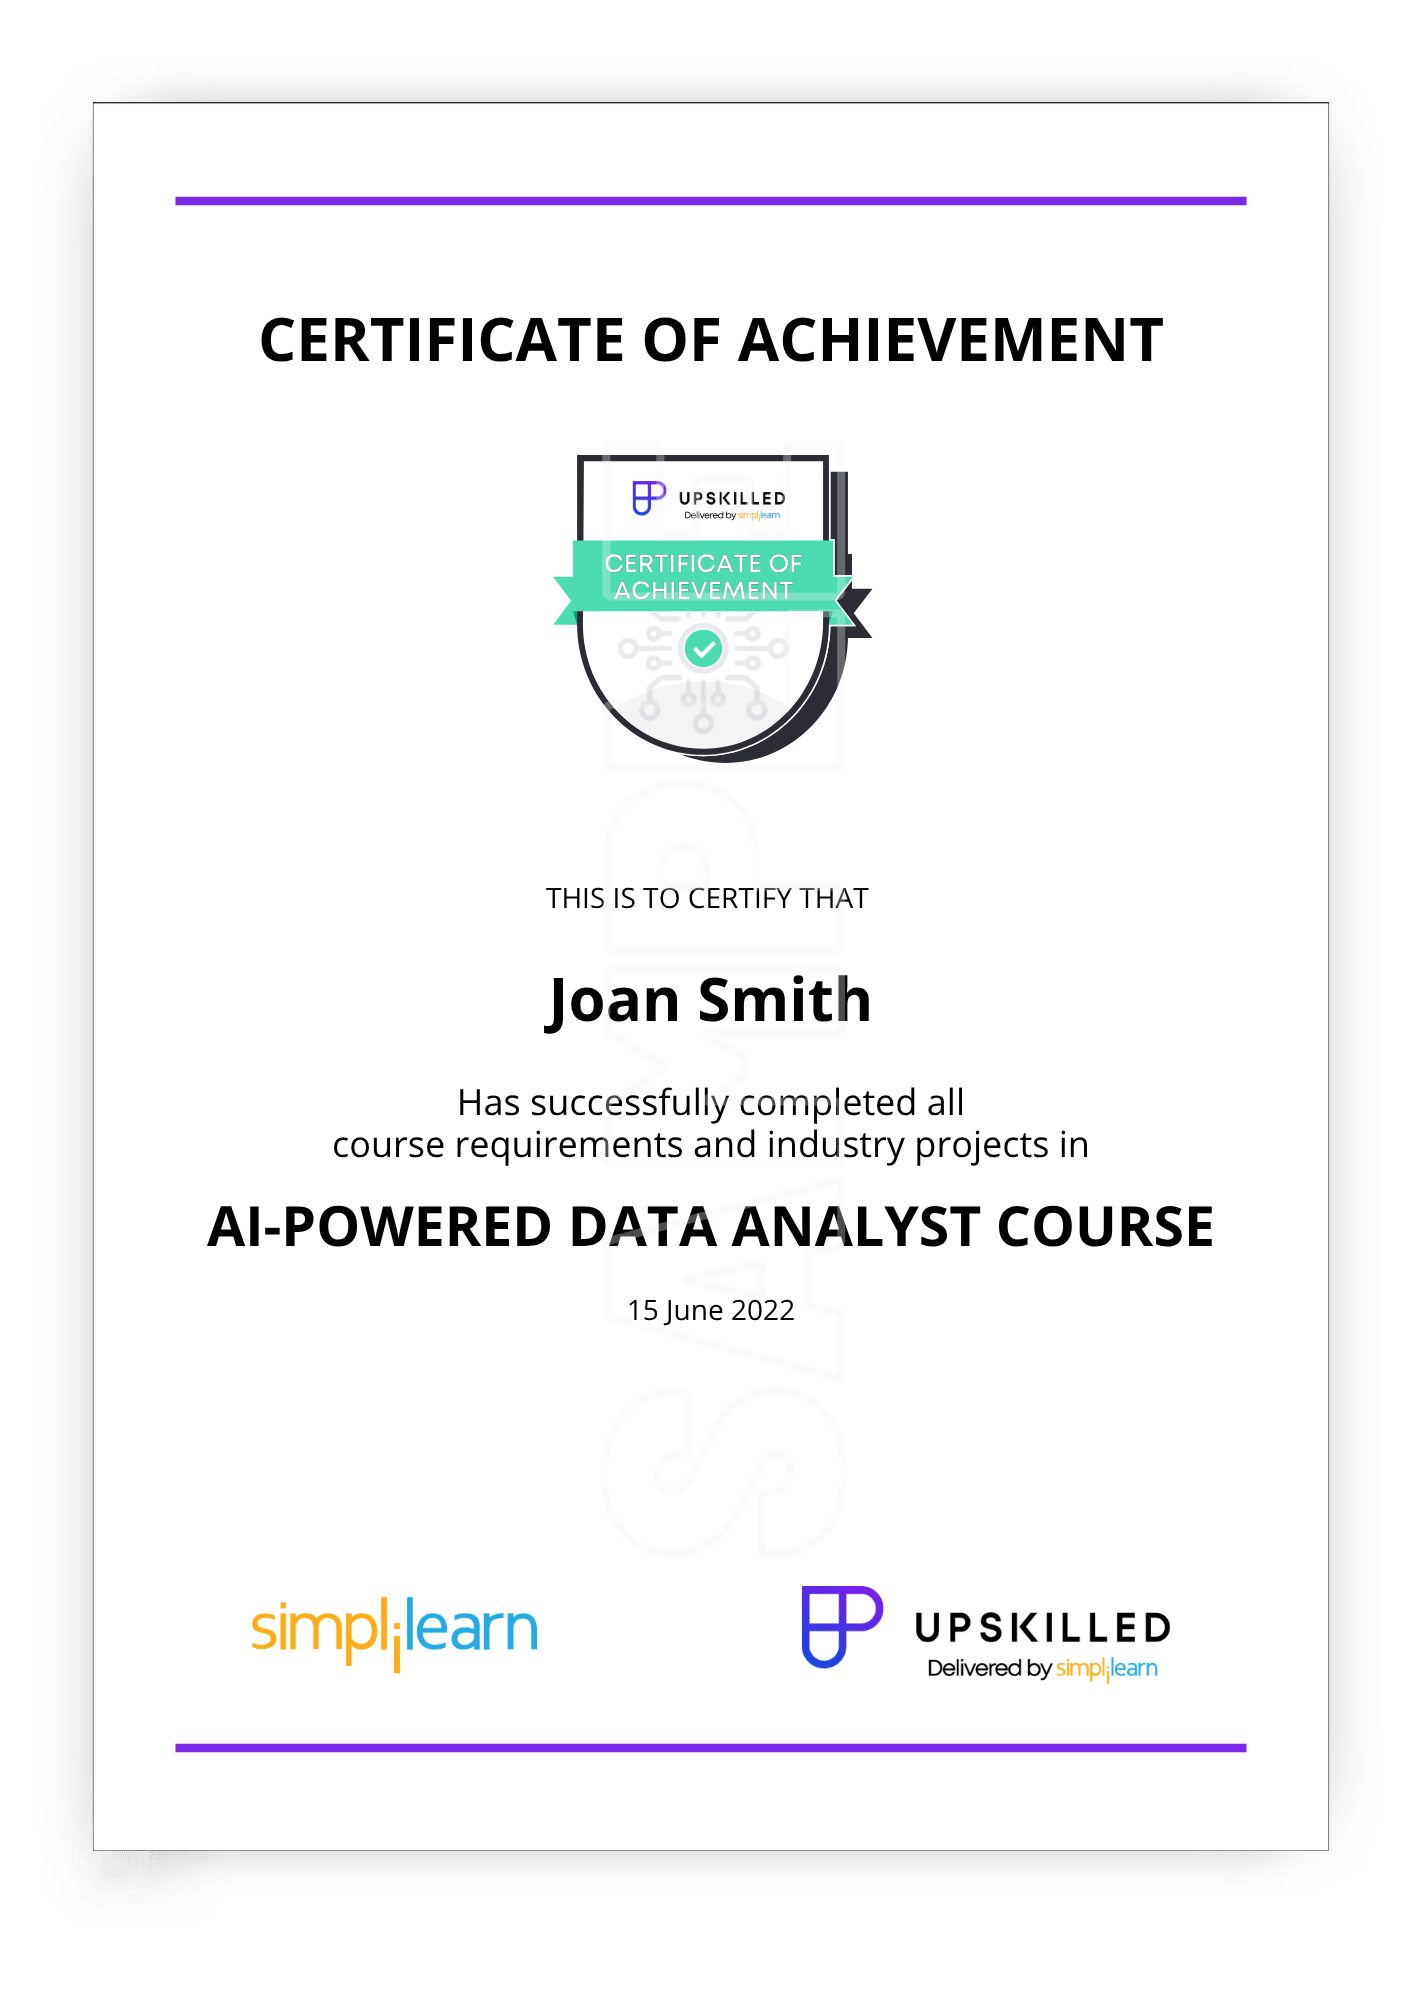
When you finish the course, you'll receive a Certificate of Completion for the AI-Powered Data Analyst Course from Simplilearn, which employers can verify online. You'll also earn a certificate for each module along the way, plus Microsoft course completion certificates on Microsoft Learn for the Microsoft electives you complete.

AI-Powered-Data-Analyst-Course-Cert.png

This is a non-accredited short course, so it isn't a nationally recognised qualification. The Microsoft certificates show you completed Microsoft's course content and are separate from the PL-300 exam.

Differentiate yourself

The certificate is useful, but your portfolio is what employers will want to talk about. By the end you'll have more than 10 projects and a capstone showing you can work with real data, use AI tools responsibly and explain what the numbers mean.

Share your achievement

Put your certificate on LinkedIn and your CV, and link to your projects so employers can look at the work themselves.

FAQs

It's an online data analytics course delivered by Simplilearn in collaboration with Microsoft. You'll cover statistics, data pipelines, Excel, SQL, Python and Tableau, using AI tools like Copilot at each step. The course also includes no-code automation and a capstone project. Two optional electives cover Power BI and industry analytics.

You have 12 months of access to complete the course, and you can work through it at a pace that suits you. The course includes more than 80 hours of live online classes, plus self-paced lessons, guided practice and projects. Live class times vary between intakes, and recordings are available if you miss one, so plenty of people study while working full-time. An Education Consultant can check the current schedule with you.

There aren’t many. It’s an entry-level course, so you don’t need coding experience or any background in SQL, Python or Tableau. You don’t need to be a maths whiz either. If you’re comfortable with basic maths and everyday tools like Excel, you’re ready, because the first module teaches the statistics analysts use most in a practical way. Copilot and no-code tools then take some of the load off as you build up to SQL and Python.

You could apply for roles such as Data Analyst, Junior Data Analyst, Reporting Analyst, Business Intelligence Analyst or Business Analyst. Data analysis is one of the more in-demand skill sets in tech, and analysts who are comfortable with AI and automation tools tend to stand out. Pay depends on your experience, industry and location, and the Career Outcomes section on this page shows typical salaries. If you’d rather stay where you are, these skills help you take on more analytical work in your current job.

You'll use Microsoft Copilot in Excel and for writing SQL, GitHub Copilot when coding in Python, AI predictions in Tableau, and automation tools such as Zapier, Make, n8n and Power Automate that can include AI steps. The industry elective also introduces Microsoft 365 Copilot agents. At every stage you'll also practise checking what the AI gives you before you use it.

Yes. The optional Power BI elective includes training aligned to the Microsoft PL-300 Power BI Data Analyst exam, covering data modelling, DAX and report design. An exam voucher isn't included, so if you want to sit the exam, you'll book and pay for it directly with Microsoft.

You'll receive a Certificate of Completion from Simplilearn when you finish the course, plus a certificate for each module. The Microsoft electives come with Microsoft course completion certificates on Microsoft Learn. These are completion certificates, not a Microsoft Certification. This is a non-accredited short course, so it isn't a nationally recognised qualification.

A Data Analyst collects, cleans and analyses data to help a business make better decisions. Day to day, that might mean writing SQL queries, building dashboards in Power BI or Tableau, spotting trends and explaining them to people who aren't data experts. These days, it also involves using AI tools for routine work and checking that the results are right.

A Data Analyst collects, cleans and interprets data to answer a specific business question. A Data Scientist works further upstream, deciding which questions to ask and building models, often with machine learning, to predict what might happen next. Many people start as analysts and move into data science later. To compare responsibilities, skills and salaries, read more here.

A Data Analyst focuses on the data itself, finding trends and answering questions with numbers. A Business Analyst uses data alongside conversations with stakeholders to recommend changes to processes, products or technology. The two roles often work closely together. To compare responsibilities, skills and salaries, read more here.